Interactive Python Dashboards with Plotly and Dash

About Course
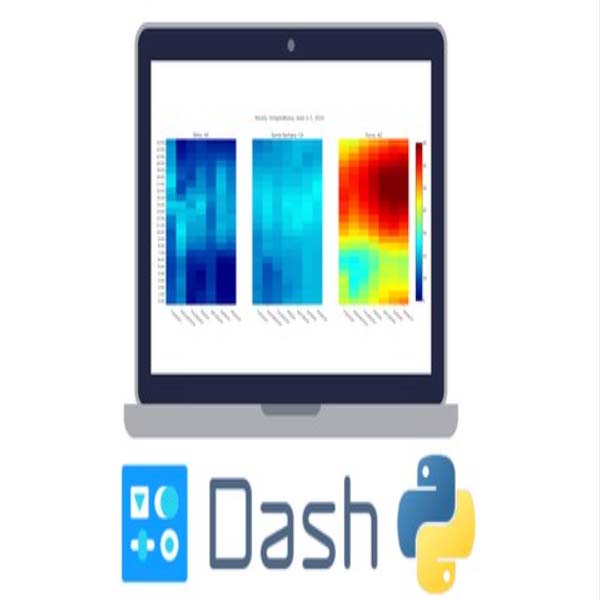
Learn how to create interactive dashboards with Plotly and Dash in this free Python course! This comprehensive course will teach you everything you need to know about using Python to create interactive dashboards.
This free course includes example code, explanatory videos, student support in our chat channels, Question and Answer Forums, and interactive exercises. You’ll learn about basic data visualization with Plotly, including scatter plots, line charts, bar charts, bubble charts, box plots, histograms, distribution plots, heat maps, and more. You’ll also learn how to create layouts for dashboards, how to have interactive callbacks, dealing with multiple inputs and outputs, creating interactive components, and more.
This course is completely free of cost and is from platforms like Udemy, Udacity, Coursera, MasterClass, NearPeer, and other platforms. Enroll today and start learning data visualization with Python!
Course Content
Course Introduction
-
A Message from the Professor
-
Course Overview
08:47 -
Overview of Notes and Guidebook
04:27 -
Installation Overview
18:40 -
Course Material Download Link
00:00
Introduction to Data Basics
Plotly Basics
Dash Basics – Layout
DashBoard Exercise
DashBoard Components
Interactive Components
Callbacks with State
Interacting with Visualizations
Code Along Milestone Project
Live Updating
Deployment
Earn a certificate
Add this certificate to your resume to demonstrate your skills & increase your chances of getting noticed.

Student Ratings & Reviews


